 Menu
Menu
- Home
- Managing An Irrigation System
- Planning System Hardware
- Farm Irrigation Systems & Cost Analysis
- Water Resource Development
- Micro Irrigation Handbook
- Related Links

Water Management And Scheduling
Ted W. Tyson, Extension Agricultural Engineer
Larry M. Curtis, Extension Agricultural Engineer
The advantage of micro-irrigation over other irrigation methods is the capability of using less energy and water while at the same time maintaining optimum sod moisture for crop growth. This design capability alone, however, does not guarantee cost effective operation--consistently applying the right amounts of water at the right times so as to take maximum advantage of crop potential and meet the high yield and quality demands of today's markets.
Applying too much water wastes both water and pumping energy and leaches nutrients from the crop root zone. Not applying enough water at the right time reduces potential yield and quality-losses that begin to occur before drought stress becomes apparent. Achieving optimum profitability of a micro- system calls for a comprehensive water management and scheduling program.
Available Water: Key to Crop Growth
For best growth, plants must have a sufficient supply of readily available water. The concept of available water is the key to successful micro-irrigation, and understanding how it works requires knowledge of the inter-relationships between plants, soil and water.
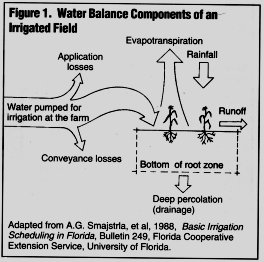
The volume of soil that contains a plant's active feeder roots acts as the plant's soil water reservoir. Figure 1 shows the water balance that occurs in the soil water reservoir of an irrigated crop. The amount of stored soil water decreases due to evapotranspiration (the combination of evaporation and transpiration through the plants). Additions of irrigation and rainfall that are not lost to surface runoff or deep percolation increase the amount of stored soil water.
Each soil texture has a certain porosity or pore space. During rainfall or irrigation, water fills these soil open spaces, with drainage taking place after saturation. The amount of water stored in the soil 12 to 24 hours after saturation by a heavy rain or irrigation is the field capacity of that soil. As soil moisture is reduced by evapotranspiration progressively below field capacity, water is held more and more tightly by the soil until a point is reached when water uptake through plant roots for all practical purposes stops. This is the soil's permanent wilting point. Some water remains in the soil but is only minimally available to plants.
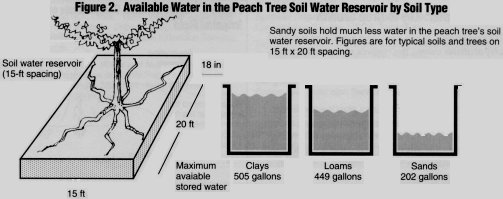
The difference between field capacity and permanent wilting point is the potential total water amount that can be stored in the soil and used by the plant, the available water holding capacity (AWHC) of the soil. Since soil moisture is most easily taken up by plants when the soil is near field capacity, plant growth and yield are optimized when soil moisture is maintained at the upper end of the available water range for the particular soil. The available water holding capacities of different soils vary greatly, as shown in Table 1 and Figure 2. Thus soil texture is a primary factor in all water management decisions.
Crop type and cultural practices are also important factors. The chief considerations are the size of the plant's soil water reservoir and the size of the micro-irrigation wetted area, which may be anywhere between 25% and 100% of the total root zone. Crops grown on plastic mulch require more careful management because irrigation must supply all water needed and because the plant root zone is restricted. Although basic micro-inigation water management principles will be the same, each crop, cultural practice and soil type will have its own particular requirements.
Table 1. Availability Water Holding Capacity for Selected Soils
| Soil Texture | Inch/(Ft/Ft) | Gal/Cu Ft |
| Sands | .02-.06 |
.15-.45 |
| Fine Sands | .05-.08 |
.37-.60 |
| Loamy Sand | .06-.10 |
.45-.75 |
| Loamy Fine Sand | .07-.11 |
.52-.82 |
| Sandy Loam | .10-.14 |
.75-1.05 |
| Fine Sandy Loam | .11-.15 |
.82-1.12 |
| Very Fine Sandy Loam | .13-.20 |
.97-1.50 |
| Loam | .15-.20 |
1.12-1.50 |
| Sandy Clay Loam | .12-.17 |
.90-1.27 |
| Clay Loam | .15-.20 |
1.12-1.50 |
| Silty Clay Loam | .18-.22 |
1.35-1.65 |
Source:Alabama Soil Conservation Service file data.
Crop Water Use Rates
In Alabama, almost all losses of available water from the crop soil water reservoir occur through evapotranspiration (ET), with the primary factor being transpiration. In this process, water moves from the soil into the roots, up the plant stalk or stems into the leaves, and exits to the atmosphere as water vapor through microscopic holes in the leaves.
Evapotranspiration is driven primarily by weather conditions that create water evaporative demand. That is, evapotranspiration will be highest on sunny, hot, windy days with low humidity, However, the ET rate also depends on the amount of actively growing crop foliage present. For most crops, the plant growth process (from spring to mid or late summer) coincides with increasing evaporative demand. On peak water demand days a mature crop may have an ET rate of .24 inches per day or more.
Maintaining Optimum Available Water
Under micro-irrigation, applications are scheduled to maintain soil available moisture at near maximum levels for optimum crop growth. Achieving this goal usually requires daily applications, and this requirement is a basic design criteria for micro- systems. That is, system pumping capacity and zone set time are usually calculated so that the system will be able to replace the expected peak crop water use (unless deficit irrigation is planned) for all zones on a daily basis.
Available soil moisture can be monitored. As soil dries, the force that plants must exert to extract water increases. This soil moisture tension is indicated (in centibars) by tensiometers or improved solid-state electrical resistance blocks. Low centibar values indicate a relatively high percentage of available water that plants can take up with relative ease. High values indicate relatively lower percentages and signal that soil moisture, while available, will be less easily made use of by plants.
The same centibar value will indicate a different available water percentage for different soil textures. Figure 3 shows typical relationships between SMT readings and available water percentages for selected soils. A loam soil, for example, at 20 cb might have 91% available water (9% depletion), while a sandy loam at 20 cb might have only 73% available (27% depletion). For details on use and care of SMT devices such as tensiometers and electrical resistance blocks, see Circular ANR-467, Scheduling Irrigation Using Soil Moisture Tension.
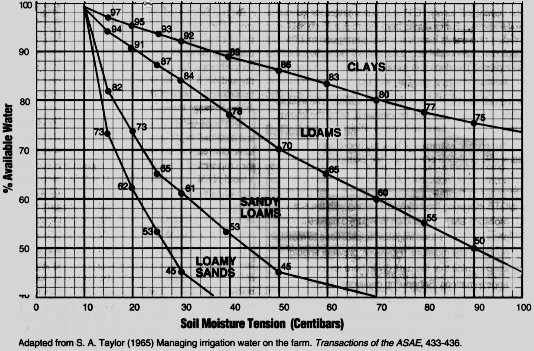
Figure 3. Soil Moisture Release Curves for Four Soil Textures Commonly Irrigated in Alabama
Successful micro-irrigation water management requires close monitoring of crop water use and the resulting soil water balance. Using both pan evaporation and soil moisture tension observations, irrigation applications can be fine-tuned to maintain optimum conditions for crop growth.The basic steps in micro-irrigation scheduling are:
Step 1. Decide the allowable depletion of soil moisture to be used as a basis for scheduling decisions.
Step 2. Estimate daily crop water use by observing pan evaporation, making adjustments as indicated by tracking crop root zone available water trend through soil moisture tension (SMT) readings.
Step 3. Irrigate daily to replace the crop water use estimate.
Step 4. Verify irrigation amount actually applied, making adjustments as needed.
Step 1 is normally done only once, at the beginning of the irrigation season; step 2 is repeated at the beginning of each scheduling period, usually daily for row crops and weekly for orchard crops; steps 3 and 4 are repeated on a daily basis throughout the growing season. The following section explains these steps in detail.
Scheduling Procedure
Step 1. Decide the allowable depletion of soil moisture to be used as a basis for scheduling decisions.
The allowable depletion is determined by considering the percentage amount of available water in the wetted root zone, as indicated by soil moisture tension (SMT) readings. A general recommendation is to maintain SMT in the 10- to 20- centibar (cb) range and available water above 80-85% (15% to 20% depletion). The specific allowable depletion should be chosen depending on soil type and crop and cultural practices.
Explanation: Using a low percentage allowable depletion (15-20%) and keeping available water amounts in the range where SMT is low (10-20 cb) helps insure that plants will have an adequate amount of readily available water to draw from and that application amounts will be within the per day design capability of the irrigation system.
Figure 3, used with AWHC figures for the particular soil type, provides a basis for estimating the approximate application amount that would be needed for a particular allowable depletion point. Growers should check Soil Conservation Service AWHC data for their soil type, determined from the county soil survey. (Table 1 shows ranges for general soil textures.) For example, from Figure 3, a 15 cb SMT reading on a sandy loam soil would correspond to 18% depletion (82% available). If the soil AWHC is .90 gal/cu ft, to replenish this depletion would call for
.18 X.90 gal/cu ft =.16 gal/cu ft
to be delivered to the crop wetted root zone. The total application amount can then be estimated, using the known crop root zone volume and system efficiency factor.
For specific examples of how to choose appropriate allowable depletion percentage, see examples on page 6.
| NOTE: Knowing the soil AWHC along with the soil moisture-SMT data shown in Figure 3 makes it possible to fine-tune irrigation applications to maintain optimum soil moisture. However, growers should keep in mind that the data given here are only approximations. Scheduling decisions, accordingly, should be based on calculations from the data made in as precise a manner as possible, followed up by continual monitoring of results and adjustments to the procedure as needed. |
Step 2. Estimate daily crop water use by monitoring pan evaporation; monitor soil moisture trend as indicated by SMT readings and adjust pan factor (Kp) as needed.
Since crop water use is directly related to water evaporative demand, the crop evapotranspiration (ETc) can be estimated in comparison with pan evaporation (Epan). Daily Epan readings provide a practical basis for estimating daily ETc by use of a pan factor (Kp) and thus determining application amounts to replace crop water use. SMT readings verify the accuracy of the ETc estimate and provide a basis for adjusting Kp to keep soil moisture in the optimum range
Explanation: Daily Epan reports for selected sites are given in the Crop Weather Summary from the Alabama Agricultural Statistics Service. For a local site, a galvanized washtub can be used. (For details, see the Alabama Micro-Irrigation Handbook appendix.) Since Epan differs from actual crop water use, a pan factor (Kp) is used to estimate ETc from Epan. For example, if Epan is checked at 0.15 inches and Kp is assumed to be 0.5, the daily crop use ETc is estimated as 0.075 inches:
0.50 (Kp) x 0. 15 in (Epan) = 0.075 in (ETc)
The pan factor used depends on the growth stage of the crop. For vegetable crops, Kp may average .10 to.15 for the first third of the season, .40 to .50 during the middle third, and .60 to .85 during the last third of the season. For orchard crops, Kp varies between establishment and maturity and not over a single season. After tree foliage reaches maximum coverage of the orchard area, Kp can be in the .60 to .85 range throughout the season.
SMT readings show the results of irrigation or rainfall soil moisture. Readings should be recorded daily at the same time early in the morning from SMT sensors placed the crop wetted zone. The important point is not to permit a trend of SMT rising above 20 cb (too little water). If substantial rainfall is received, the crop irrigated soil water reservoir is likely to be filled. The irrigation program should be suspended until SMT sensors indicate crop water extraction has resumed (SMT rising into the 10-20 cb range).
For orchard crops, ETc estimates can be made weekly, based on the previous week Epan daily average and the SMT trend. ETc estimates need to be made daily for vegetable or row crops. If SMT readings over tune indicate application amounts need to be adjusted, the simplest procedure is to adjust Kp in 5% steps. For example, if SMT is rising above 20 cb and the pan factor used has been .50, a just Kp to .55. Continue adjustments until SMT readings stabilize in the 10-20 centibar range.
Step 3. Irrigate daily to replace the crop water use estimate.
To calculate irrigation amounts, convert the ETc estimate to gallons, then determine operation time: FIRST, convert inches to gallons per acre and per zone:
ETc (inches) X 27,154 (gal/acre-in) = gallons/acre
For example, if the ETc estimate is .18 inches per day, the number of gallons per acre to apply is:
.18 in X 27,154 gal/acre-in = 4,888 gal/acre
If the zone size is 10 acres, the net amount of water to be applied is
10 acres X 4,888 gal/acre = 48,880 gallons.
SECOND, apply the system efficiency rating to find out how much water must be pumped to actually apply this amount. As a rule of thumb, assume that drip tape and micro-sprinkler/sprayers are 80% efficient, and drip emitters 90% efficient. For example, if system efficiency is 90% and amount to be applied is 48,880 gallons, amount to be pumped is: 48,880 gallons ÷:.90 = 54,311 gallons
THIRD, figure how long the system must run to pump this amount of water. To make this calculation you must know the system flow rate in gallons per hour. For example, if system flow rate is 200 gallons per minute, rate per hour is 60 X 200 = 12,000 gal/hr. If amount to be pumped is 54,311 gallons, time needed is:
54,311 gal÷12,000 gal/hr = 4.5 hours (approx.)
NOTE: Record flow meter reading before starting system.
| IMPORTANT: Instead of applying the entire day's crop water need in one application, several short applications may be needed, totaling the calculated daily ETc. This is true where plants have limited root zones, either for young plants early in the season or for crops on plastic mulched beds, and may be true for any crop on sandy soils. On sandy soils, the soil in the root zone of the crop may not be able to hold the entire peak water demand (ETc) of the crop in one application. If the soil AWHC is exceeded, part of the water applied will be lost, percolating below and leaching needed nutrients from the root zone. In such a case, a crop can be irrigated every day (in one application) and still experience drought stress during part of each day. On these soils, irrigating each zone twice or even three times a day may be necessary during times of peak water demand. See the sidebar, How Can Drought Stress Occur.... |
Step 4. Verify application amount and make adjustments if needed.
Flow meter readings must be used to verify amounts actually applied System design specifications can be used as a guide, but an accurate propeller-type flow meter should be used as the best indication of actual flow rate and amount pumped.
For example, if the application amount (Step 3) is 54,311 gallons, beginning flow meter reading is 22,450 and ending reading is 76,920, the flow meter indicates that 76,920 - 22,450 = 54,470 gallons have been applied. This is an insignificant difference (less than 1%). For larger differences, pumping time can be adjusted using the metered system flow rate. In this example, if pumping time is 4.5 hours the actual system flow rate is 54,470 gal ÷4.5 hrs = 12,104 gal/hr.
Differences of over 10% between actual and design flow rate may indicate system problems. If actual flow is higher than design flow rate, there may be a leak. If actual flow is lower, there may be blockage or clogged emitters.
Specific details involved in carrying out these general steps vary according to the crop, soil type, cultural practices, etc. For detailed case examples, see the appendix to the Alabama Micro-Irrigation Handbook. Automatic controllers, using SMT devices equipped with switches to control system on-off time, can be used in conjunction with close monitoring of the system to more precisely maintain optimum soil moisture in the plant root zone.
Deficit Irrigation
Micro-irrigation systems used for tree crop irrigation are often designed to replace only a portion of the expected peak crop water use. Such "deficit irrigation" supplements rainfall and helps extend the "drought cushion" provided by the entire rain-supplied root zone. It will not protect against extended drought. System design capacity must therefore be adequate to create a drought cushion sufficiently long to protect against all but the most extreme drought. under drought conditions, allowable depletion will be exceeded. If the system design specifications for zone set time allow a safety margin for down time, etc., the set time can be extended to compensate for drought. Deficit irrigation usually is practical only on soils with high available water holding capacity, such as loams, days or clay loams.
Determining Allowable Depletion
Following are examples of how to choose appropriate allowable depletion for two typical situations, orchard crops and vegetables grown on plastic mulch. For more details, see Scheduling Case Examples in appendix of the Alabama Micro-Irrigation Handbook.
Orchard crop
3 zones of 3 acres each, using drip emitters, on Sandy Clay Loam soil, AWHQ 1.05 gal/cu ft (NRCS data); crop rooting depth 2 ft, 43% orchard floor wetted area; system application efficiency = 90%
1. Calculate wetted root volume and AWHC per zone:
43,560 sq ft/acre X .43 wetted % X 2 ft moisture control depth X 3 acres/zone = 112,385 cu ft/zone
AWHC in this volume: 112,385 cu ft X 1.05 gal/cu ft = 118,004 gal
2. From Figure 3 soil moisture release curve for loams, estimate deficit at 10, 15, 20, and 25 cb:
10 cb- 2% depletion-118,004 gal AWHC X .02 = 2,360 gal
15 cb- 6% depletion-118,004 gal AWHC X.06 = 7,080 gal
20 cb- 9% depletion-118,004 gal AWHC X.09 = 10,620 gal
25 cb-13% depletion-118,004 gal AWHC X . 13 = 15,340 gal
Decision: Allow not more than 9% depletion, since higher depletion would exceed the optimum 10-
20 cb range. Application amount required to replace 9% depletion is:
10,620 gallons ÷.9 efficiency = 11,800 gallons.
NOTE: Since orchard systems in Alabama are usually designed as "deficit irrigation" systems, the
allowable depletion usually cannot be maintained during severe drought periods. See Scheduling
Irrigation: Case Examples in the Alabama Micro-Irrigation Handbook.
Vegetable crop on plastic mulch
3 zones of 3 acres each, using drip tape on 30 inch bed, 6 foot row spacing; Sandy Loam soil, AWHC: 0.9 gal/cu ft (NRCS data); rooting depth 12 inches; system application efficiency = 80%
1. Calculate wetted root volume and AWHC per zone:
2.5 ft bed width X 1 ft root depth X 7260 row-ft/acre (Table 2) X 3 acres/zone = 54,450 cu ft/zone
AWHC in this volume: 54,450 cu ft X 0.9 gal/cu ft = 49,005 gal
2. From Figure 3 soil moisture release curve for sandy loams, estimate depletion in 10-20 cb range:
10cb-2%depletion-49,005 gal AWHC X.02 = 980gal
14 cb-15% depletion-49,005 gal AWHC X . 15 = 7,351 gal
15 cb-18% depletion-49,005 gal AWHC X . 18 = 8,821 gal
16 cb-20% depletion-49,005 gal AWHC X.20 = 9,801 gal
20 cb-27% depletion-49,005 gal AWHC X.27 = 13,231 gal
Decision- Set allowable depletion no higher than 20%, corresponding to 16 cb. For plastic mulch cul
ture, 15% allowable depletion (14 cb) may be preferred. Required application amounts:
.15 depletion X 49,005 gal = 7,351 gal ÷.8 efficiency = 9,189 gal
.20 depletion X 49,005 gal = 9,801 gal ÷.8 efficiency= 12,251 gal
| Row spacing (ft) | 1 |
3 |
4 |
5 |
6 |
10 |
12 |
| 100-ft lengths/acre | 435.6 |
145.2 | 108.9 | 87.1 | 72.6 | 43.6 | 36.3 |
Table 2. Number of 100-ft Lengths of Drip Tape/Acre, by Row Spacing
How Can Drought Stress Occur When I'm Irrigating Every Day.? ANSWER: If your crop is on a sandy soil and you're using only one irrigation cycle per day during the time of peak water need. You think you're replacing the entire daily crop water use, but much-maybe most-of the water applied is lost to percolation below the root zone. EXAMPLE: You have a vegetable crop in 6-foot rows with typical one foot rooting depth on a loamy sand soil, using drip tape rated at.4 gpm/100 ft of row. Your moisture management goal is to maintain 80% AWHC (less than 20% depletion), and peak crop water use (ETc) is .18 inches. Calculating time to apply the replacement water (using a per acre basis): Crop water need (ETc): .18 in X 27,154 gal/acre-in 0÷ .80 efficiency = 6,110 gal/acre Flow rate: .4 gpm/100-ft row X 72.6 1 00-ft rows/acre*= 29 gpm/acre Time to replace depletion: 6,110 gal ÷ 29 gal/min = 211 minutes HOWEVER: You must also consider the AWHC of the soil in the wetted root zone AND your moisture management goal. Lateral water distribution in loamy sand soil typically averages only about 3 feet in the top 1 foot of root zone, so the wetted root zone volume will be small. And you must begin irrigating before the wetted soil volume moisture drops below 80% of its maximum (the allowable depletion point). The key question is: how much added irrigation water will the wetted soil volume be able to accept and hold at the allowable depletion point? Calculations: Wetted soil volume/acre: 3 ft X 1 ft X 7,260 ft = 21,780 cu ft (7,260 linear bed-ft/acre, from Table 2) Loamy sand AWHC per cubic foot (NRCS data) =.6 gal/cu ft Wetted soil AWHC per acre: .6 gal/cu ft X 21,780 cu ft = 13,068 gal Quantity of water to replace 20% depletion: .2 X 13,068 gal ÷ .80 efficiency = 3,267 gal Time to replace 20% depletion at 29 gpm/acre: 3,267 gal ÷ 29gal/min=113 min RESULT: The 20% depletion is replaced in 113 minutes. For the rest of the cycle (98 minutes), applied water soaks below the root zone, carrying fertilizers with it, wasting water and energy and potentially polluting ground water. Available soil moisture has been brought to 100%, BUT at the end of this 211 minutes of operating time (3 hrs 31 min) evapotranspiration still has most of the long, hot day to withdraw soil moisture at its peak rate. Result: soil moisture drops well below your 80% allowable depletion and the crop suffers quality and yield loss from drought stress! BETTER SCHEDULING: Operate in two 106-minute cycles each day (211 2 = 106 min/cycle), in early morning and early afternoon. And automate the system to ensure that applications are made at the right times to keep soil moisture from falling below the allowable depletion point. * (from Table 2) |
Just How Important IS Water Management?
In more than one instance, properly-operated microsystems have generated enough additional income in one growing season to completely pay off the system cost. That's good news-installing micro-irrigation costs a great deal of money. There is, however, a flip side. Micro- can produce top quality, yield, and returns because of its precision capability to economically maintain optimum soil moisture on a daily basis. However, if a grower fails to carry through on the capital investment--that is, doesn't follow a top-quality, day-by-day water management and scheduling program--a very likely result will be NO additional returns. Which means that the capital investment turns into a dead loss. The bottom line: water management for micro-irrigation isn't just important-it's essential.
References
Clark, G.A. 1992. Drip irrigation management and scheduling for vegetable production. HortTechnology 2(1) Jan/Mar 1992, 32-37.
Clark, G.A. et al. 1990. Irrigation Scheduling and Management of Micro-Irrigated Tomatoes. Circular 872, Florida Cooperative Extension Service, University of Florida.
Clark, G.A. et al. 1991. Micro-Irrigation on Mulched Bed Systems; Components, System Capacities and Management. Bulletin 245, Florida Cooperative Extension Service, University of Florida.
Clark, G.A. et al. 1987. Tensiometer control and fertigation of micro irrigated tomatoes. ASAE Paper no. 87-2520, American Society of Agricultural Engineers, St. Joseph Mi.
Harrison, K.A. 1989. Irrigation for peaches, in Peach Production Handbook, ed. S.C. Myers, Georgia Agricultural Expriment Station Handbook No. 1, University of Georgia.
Hochmuth, G.J. and G.A. Clark. 1991. Fertifizer Application and Management for Micro (or Drip) Irrigated Vegetables in Florida. SS-VEC-45, Florida Cooperative Extension Service, University of Florida.
Locascio, S.J. et al. 1992. Water and Nutrient Requirements for Drip-irrigated Vegetables in Humid Regions. Southern Cooperative Series Bulletin 363, Agricultural Experiment Station, IFAS, University of Florida.I
Rhoads, F.M. 1990. Irrigation Use by Mulched Staked Tomatoes in North Florida. NFREC, Quincy Research Report 90-17, Florida Agricultural Experiment Station, University of Florida.
Rhoads, F.M. and S.M. Olson. 1992. Irrigation of Fall Tomatoes in North Florida. NFREC, Quincy Res. Rpt. 92-3, Florida Agricultural Experiment Station, University of Florida.
Smajstrla, A.G. and D.S. Harrison. 1988. Measurement of Soil Water for Irrigation Management Circular 532, Florida Cooperative Extension Service, University of Florida.
Smajstrla, A.G. et al. 1984. Tensiometers for Soil Moisture Measurement and Irrigation Scheduling. Circular 487, Florida Cooperative Extension Service, University of Florida.
Smajstrla, A.G. et al. 1988. Basic Irrigation Scheduling in Florida. Bulletin 249, Florida Cooperative Extension Service, University of Florida.
Sprinkler Irrigation Guide for Alabama. Nodate. Natural Resources Conservation Service, USDA, Auburn AL.
Taylor, S.A. 1965. Managing irrigation water on the farm. Transactions of the ASAE, 1965, 433-436.
Tyson, T.W. and L.M. Curtis. 1989. Scheduling Irrigation Using Soil Moisture Tension. Circular ANR-467, Alabama Cooperative Extension Service, Auburn University.
| Publications included in the Alabama Micro-irrigation Handbook present up-to-date information on practical irrigation methods that save energy and water while protecting water quality. For more information, see your county Extension agent. |
Publication No.
MicroIrrigation Handbook ANR-647 |
OCT. 1998 |
Larry M. Curtis, Extension Agricultural Engineer, Professor, Biosystems and Agricultural Engineering, and Ted W. Tyson, Extension Agricultural Engineer, Associate Professor, Biosystems and Agricultural Engineering. |
Issued in furtherance of Cooperative Extension work in agriculture and home economics, Acts of May 8 and June 30, 1914, and other related acts, in cooperation with the U.S. Department of Agriculture. The Alabama Cooperative Extension System (Alabama A&M University and Auburn University) offers educational programs, materials, and equal opportunity employment to all people without regard to race, color, national origin, religion, sex, age, veteran status, or disability.
This document is author-produced (unedited).

