CAWV and CAFO Continuing Education
Module R1. Alabama's Phosphorus Index and Nutrient Management with Litter and Animal Manures
Alabama’s P Index was developed because of growing national concern about phosphorus runoff from fields that were over-fertilized with P whether from fertilizers or animal manures. The Natural Resources Conservation Service (USDA-NRCS) in Alabama incorporated the P Index as an important part of its standard for nutrient management.
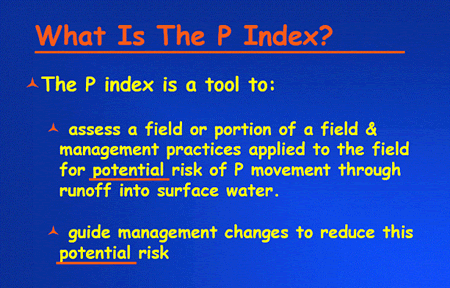
Each state developed a P Index to fit the type of agriculture, soils, and environmental conditions unique to each state. The purpose of a P Index is to assess a field or portion of a field and the management practices associated with that field for the potential risk of P movement through runoff into surface waters and guide management changes to reduce this potential risk . The higher the P Index value, the higher the risk of P runoff. Therefore, the objective of a good nutrient management plan would be to lower the P Index as much as possible for each field.
NRCS Agronomy Tech Note AL-72, which describes the Phosphorus Index (PI), can be reviewed at http://www.aces.edu/department/aawm/PINDEXFinal2001.pdf .
A Phosphorus Index Worksheet is used for this phosphorus risk assessment:

In Alabama, most factors which are considered important in assessing P runoff can be divided into two categories, (1) Source and (2) Transport.
In Alabama, we have a few streams which are considered “impaired waters” or “outstanding waters” of the state. These streams need special attention so the “Receiving Water Characteristic” is a third characteristic to consider. Within the first two categories are the characteristics considered important in Alabama. Other states may use different categories in their P Indexes.
Soil test P level is the first characteristic to consider. The higher the soil test P rating, the higher the value assigned to this characteristic. Soil test P is not as critical as some other characteristics because soils adsorb and hold on to P. Phosphorus is not likely to move off the land unless the soil itself moves off through erosion. As you’ll see, other factors can be more critical to P runoff than soil test P.
Phosphorus application rate is a very critical factor because the more P that is applied, the higher the risk of P runoff. If you consider that poultry broiler litter contains around 60 pounds P2O5 per ton, then applying more than 3 tons per acre can really add to the P Index value. The risk of runoff is greater right after application whether it is fertilizer P or poultry litter P.
A good rule of thumb is that poultry broiler litter is about a 3-3-2 fertilizer. It contains close to 60 pounds N, 60 pound P2O5 and 40 pounds K2O per ton. Of course, this varies considerably from one house to another.
Common sense tells us that surface application is more likely to run off than if the fertilizer material is injected into the soil. Of course on pastures, we have no choice but to surface apply broiler litter. This can add up to 24 points to the P Index.
Because we have cattle on so many acres of Alabama land, especially pastures receiving poultry litter, Alabama’s P Index includes a category for grazing animals. No animals will result in no additional points to the P Index. However, if more than 100 animals have unlimited access to a stream in a pasture . . .
. . . or the animals are fed in a sensitive area near the stream, up to 8 points could be added to the P Index. However, both these characteristics are easy to change if they are the cause of a high P index. Animal access to streams can be restricted and they can be fed or watered away from sensitive areas.
While underground outlets as part of erosion control terraces are good management practices for controlling erosion, they could provide a direct access for P enriched runoff to enter a stream. If more than 30% of a field has outlets emptying into drainage ways, then 24 points are added to the P Index.
We all realize that soil erosion is a major source of P transport from a field to a stream. High erosion (>15 tons/acre) could add up to 24 points to the P index. Your county NRCS Soil Survey book has erosion information on soils. Sod crops e.g., pasture and hayfields and high residue conservation tillage could result in no additional increase in the P Index. By reducing the erosion risk, one can reduce the P index value
The hydrologic soil group can be found in the county NRCS Soil Survey book. Hydrologic soil group basically tells us how fast water moves off a given soil. Very sandy soils are in hydrologic group A with a value of 3 while very clayey, Black Belt soils are in hydrologic group D with a value of 24. This is a characteristic of the soil itself and cannot be changed.
Field slope is also a characteristic of the site and cannot be changed. Steep slopes (>8%) can contribute as much as 8 points to the P Index while flat fields with < 1% slope contribute zero points to the P Index.
Applying fertilizer or manures close to a stream (< 50 feet) can greatly increase the value of the P Index. Staying at least 400 feet away from a stream contributes nothing to the P Index.
In cultivated fields, having a filter strip is very important. Fields without a filter strip can have as much as 16 points added to the P Index.
If the field is within 400 feet of an impaired stream or an “outstanding” Alabama water, then up to 24 points can be added to the P Index. This was added to help clean up impaired streams and to protect hose streams of special importance in the State. This category will not impact most fields.
Simply by adding up the points for each characteristic, we can calculate a P Index. The goal is to have a value as low as possible. The values shown here are the maximum values for each characteristic. Some values are management dependent and can be adjusted. For example, we can reduce the planned P application rate or reduce the number of grazing animals that have access to the stream or increase the application distance to water. Others are soil or site dependent and cannot be changed.
NRCS 590 uses field P Index rating to determine field P application.
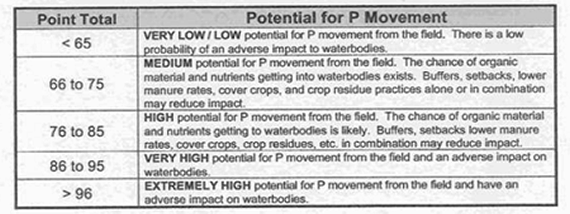
A “LOW” P index means that the risk of P movement is low. Therefore, the P content of manures and fertilizers is not a consideration. The manure or fertilizer can be applied strictly based on its nitrogen values. Otherwise, P should be applied based upon the anticipated crop removal. If the P Index is “EXTREMELY HIGH” and there is nothing the producer can do to lower the P Index, then he will have to refrain from applying any animal manures containing P. He could continue to use fertilizers that contain no P.
Hay and silage crops remove a lot of nutrients from the soil. These are ideal for fields with a VH or EH P Index. The problem is pastures. Cattle grazing pastures do not remove much P. It is recycled in the manure and urine in the field. Therefore, pastures with a high P index are difficult to fertilize with animal manures especially with broiler litter. Three times nutrient removal in a fescue pasture would not account for the nutrients in a ton of broiler litter. In this case, commercial fertilizer may be the only choice for a pasture with a High P Index.
Alabama’s P Index is not perfect but it is very easy to use. In fact, it is one of the easiest P Indexes to use among the Southern States. Any producer can look at a field and make reasonable estimates of the characteristics which contribute to the P Index.. It should not be used to try to estimate a quantity of P that could move from a field. It can be used, however, to help make management decisions to help reduce the risk of P runoff from fields. Every field that receives animal wastes in Alabama should have a P Index calculated for that field.
We will now look at five Alabama fields and use the P Index to evaluate their risk of P loss by runoff.
Let’s run through the P Index for Field no. 1.
FIELD #1
-
Total acres in field=30, no-till corn
-
Soil series = Holston loam (hydrologic group=B)
-
Slope <3% *Soil test P=“VH”
-
Recommendation for non-irrigated corn = 120-0-60 pounds N-P2O5-K2O per acre.
-
no grazing animals
-
Litter surface applied to entire field in February @ 3 tons/acre
Some PI worksheets will be very helpful to you as you complete this training. You can print some blank PI worksheets from http://www.aces.edu/department/aawm/pindexws.pdf and use them to do the following exercises.

-
Soil test P value: Soil test P is “VH” so we circle “Very High” and write 4 in the column on the right.
-
P Application Rate: Note that we indicated that we plan to apply 3 tons of litter per acre in February. If each ton contains at least 60 pounds P2O5, then we will be applying the maximum amount of P2O5 or >180 lbs per acre. Circle that category and write “24” in the column on the right.
-
Nutrient Application Method. Since this is a no-till field, we have no choice but to surface apply it. Circle “Surface Applied” and write “24” in the column on the right.
-
Grazing Animals. There are no grazing animals so circle “None” and write “0” in the column on the right.
-
Underground outlet Systems. There are no underground outlets so write “0” in the column on the right.
-
Erosion rate. Without using a more complex tool, the best we can do is guess at the most appropriate erosion rate. Most no-till fields will have a fairly low erosion rate so we can assume about 3-5 tons per acre. Write “3” in the column on the right.
-
Hydrologic soil group. We are told this soil is in hydrologic group “B”. Write “6”.
-
Field Slope. You may have to estimate slope but for this field, we are told it is less than 3%. Write”1”.
-
P Application Distance to Water. Because the field is only 25 feet from the stream, we have to assume the worst and assume that the litter will be spread up to the edge of the field. Circle “<50 ft.” and write “24” in the column.
-
Filter Strip. We really don’t have a filter strip. All we have is a riparian buffer of 25 feet. Circle “<10 ft.” and write 16 in the column.
-
Impaired or Outstanding Waters. Again, since the field is only 25 feet from an impaired stream, we have to assign it the maximum value. Write “24”.
Your worksheet should look like the one below.
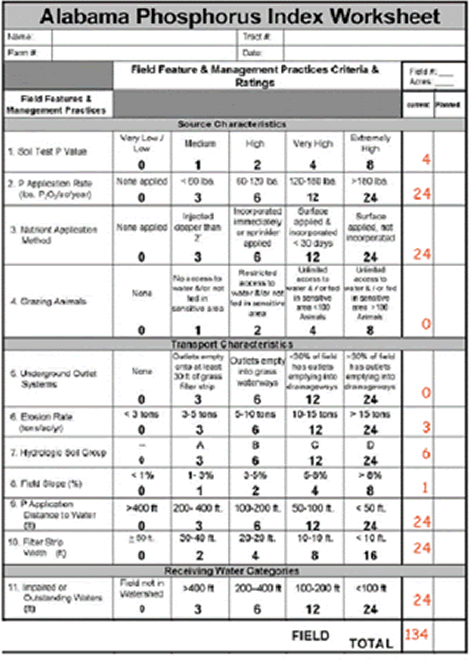
Now we simply add up all the numbers in the first column, and write down the sum which is 134. That is our P Index value or point total. Compare that with the table value below. Clearly, this field has a P Index rating of “EXTREMELY HIGH”. We need to change our practices so we can achieve a more environmentally acceptable value.

Because the soil test P value was VERY HIGH, no P fertilizer was recommended. If we go back and choose to apply commercial fertilizer without P as recommended instead of broiler litter, we could reduce the P index to VERY LOW. These new values in the right hand column are our “Planned” P Index that we can achieve by adopting some best management practices. Your worksheet should look like the one below after making these adjustments.
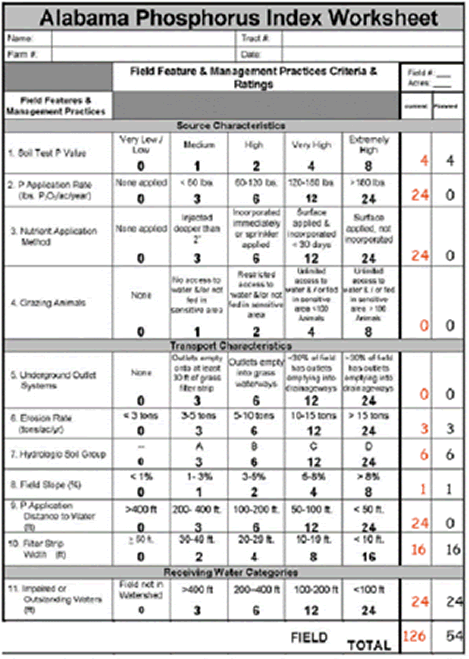
It would take applying less than 3 tons litter/ acre, backing more than 200' away from the water, and using a 50' filter strip to still be able to apply litter. What would the PI be with these practices? This would reduce "spreadable" acres below the FSA 30 acre value because you would lose the buffer areas caused by backing away from water and the filter strip. Would it be worth it? Only the landowner/operator can make that decision. Bottom line, either way you go, applying commercial N only or increasing buffers and filter strips, using the P Index this way will reduce risk of P loss to runoff from this field.
Now, you calculate a P Index on Field no. 2 through Field no. 5 using the same logic that we did on field no. 1.
FIELD #2
- 35-acre, conventionally tilled cotton
-
Soil series=Dewey si.c.l. (hydrologic group=B)
-
Slope = 3-5%
-
Soil test P=“M”
-
Soil test recommendation for cotton = 90-60-60
-
Only fertilizer P applied in past according to soil test
Using a blank worksheet, calculate a current P Index. Use management adjustments to calculate a planned P Index if the current P Index is too high.
FIELD #3
- 40-acre, continuously grazed, fescue-clover pasture
-
Soil series=Wynnville fsl (hydrologic group = B)
-
Soil test P = “EH”; Recommendation = 60-0-40
-
25 head cow-calf operation
-
slope = 3-5%
-
About 4 tons B.L. applied annually to entire field
-
Small creek through center of pasture with free access to cattle;
-
1/2-acre farm pond also present for water
Using a blank worksheet, calculate a current P Index. Use management adjustments to calculate a planned P Index if the current P Index is too high.
FIELD #4
-
25-acre, conventionally tilled corn
-
Soil = Decatur silt loam (hydrologic Group=B)
-
Soil test P = “EH”; recommendation = 120-0-0
-
slope = 3-5%
-
no grazing animals
-
4 tons litter/acre applied each spring to corn
-
50’ grassed filter strips between field and all drainage
-
no streams near field
Using a blank worksheet, calculate a current P Index. Use management adjustments to calculate a planned P Index if the current P Index is too high.
FIELD #5
- 20-acre fescue pasture
-
soil = Linker-Townley complex (Hydrologic group = B)
-
8 to 15% slope
-
Soil test P = Medium
-
Continuously grazed with 10-15 cow-calf units;
-
animals fed on top of hill near barn; water trough on hill.
-
No P applied thus far; would like to use ~2 t/a broiler litter
Using a blank worksheet, calculate a current P Index. Use management adjustments to calculate a planned P Index if the current P Index is too high.
Now let's see how well you understand Alabama's Phosphorus Index and how it is applied. Compare your estimated P Index with those calculated below. No two people will get the exact same value but the P Index ratings should be close.
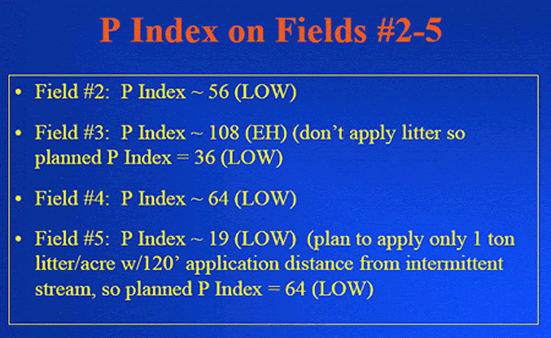
The P Index that was developed for Alabama is easy to use, flexible, and helps producers plan best management practices that will protect water quality and, in many cases, improve the efficiency of the farming operation.
NRCS Agronomy Tech Note AL-72, which describes the Phosphorus Index (PI), can be reviewed at http://www.aces.edu/department/aawm/PINDEXFinal2001.pdf .
Please return to the Course Content page (click >Course Content...> on the WebCT navigation bar at the top of this window) to take the Self-Help Test for this Module.